Patient Profiling

Patient Profiling gives you the capability to study each patient by reviewing his or her complete clinical data. In contrast to traditional clinical data listings, which present all patients by Case Report Form or Study Domain, Patient Profiling presents data on per-patient basis. The data of each patient is presented in a single consolidated view, cohesively listed on the same screen or page, empowering physicians to correlate data for research and reasoning.
Patient Profiling Function Overview
Clinical Workbench has built-in functions to support patient profiles. It has the following features:
-
Patient profile module is on every study overview page. To view, just select a subject from subject pull-down list.
-
Patient profile function is integrated with every data listing. To view, just click a hyperlinked subject number
-
Built-in All-Data, All-Columnview presents complete subject data (all datasets, all columns) on one page, it is useful for data check
-
Rich data visualization features, and you can toggle between data view to graphical view by one click
-
You can configure your own patient profile template to present selected subject data in your own presentation format
-
Patient profile template can be created through script method, allowing you to insert data views as the ¡°blocks¡±, as well as free-text and
paragraphs
-
The definition of patient profile templates can be transferred to other data loads or studies
-
Patient Profile Book Feature: You can export patient profiles from a subject-list into a document (zip file) for offline view. The subject-list can
be defined conveniently.
Patient Profile Visualization Features
Toggle between Data View to Graphics View
Patient profiles contain one or more data views. Data view is presented in the following format (List) by default. If a data view can
be rendered in chart format, then a Chart icon will be shown. You can toggle between List and Chart.
Built-in Patient Profile Charts:
Vertically-Aligned Chart Timeline:
All charts displayed on patient profiles are drawn on the same timeline using the same scale (The label, range, ticks can be configured); Data points/events from different data sources can be compared
and correlated. With this feature, you can easily associate an abnormal laboratory value to an adverse event, and a medication to the adverse
event.
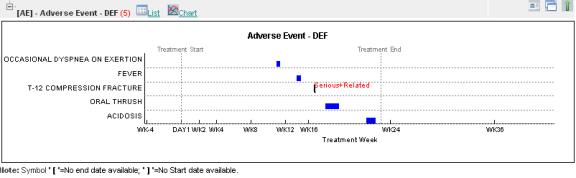
1. Adverse Event Chart:
Adverse events are drawn on treatment timeline, where serious, related, and serious related are marked in color. Treatment reference dates are drawn.
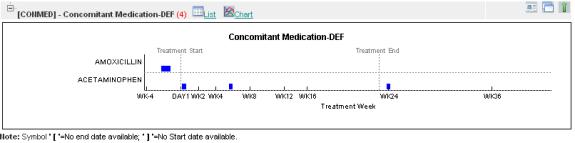
2 Concomitant Medications Chart:
Similar to adverse event chart, medications/therapies are drawn on treatment timeline with start and end references.
3. Parameter Data-Point Matrix and its Normality Chart
All lab (or lab-like measurements) tests are drawn on the treatment timeline to give you the full picture of (a) If the test/parameter is collected or not; (b) If the test is collected on schedule (c) if the test is above normal or below normal (when the normal range is present) (d) If the parameters with abormality are corrected.
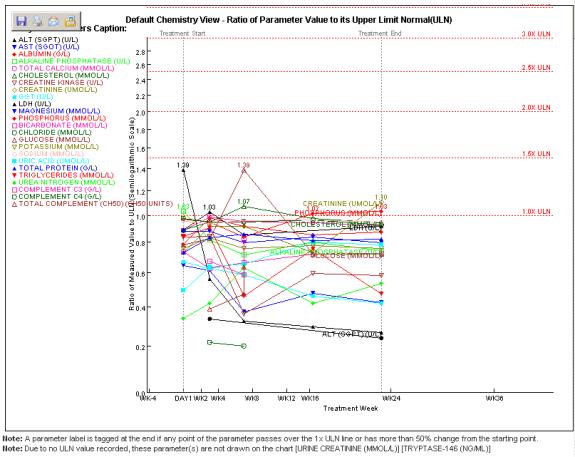
4. Ratio of Parameter Value to its Upper Limit Normal (ULN)
All lab (or lab-like measurements) tests are drawn on the treatment timeline by the percent change from baseline, and the ratio of change reference to ULN (upper limit normal).
5. Individual Parameter Value Trend
Each lab (or lab-like measurement) test is drawn on its own chart to inspect the value and trend. Treatment start/end references, as well as the normal range (high, low) are drawn when present.
Ease of Use and Customization
By default, a patient's profile will include all relevant study data of that specific patient. However, for specific profiling purposes, you may customize the content and layout as you wish. You may designate a set of predefined patients for profiling, or select patients by certain conditions. The presentation of data can be easily customized, such as by selected clinical events (visits) or by selected case report forms, etc.
Portable and Batch-Processing Capable
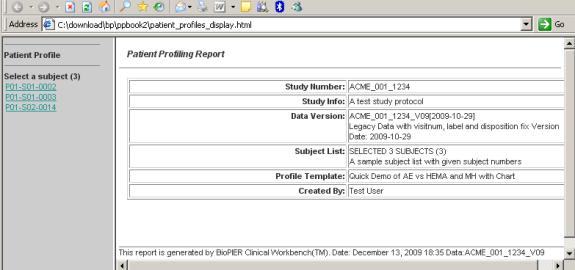
In addition to online viewing, patient profiles can be exported as patient profile book for off-line view. You can customize the output for a specific subject-list and a patient profile temmplate (layout).
An example of offline view of patient profile book (the index page)
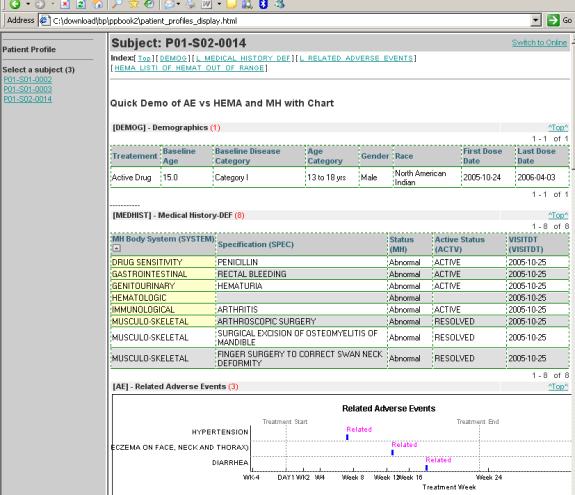
When you view a subject from patient profile book (offline view), the page layout is very similiar to online view: